Display only two axis on a graphic with matplotlib
You may find yourself asking how to display a simple graphic that only displays two axis and not a frame arround which is the default when using matplolib.
Well, you just found the answer.
You only have to store the four axis on a python list, and then set the ones you don’t want to invisible. Here is how it’s done:
import matplotlib.pyplot as plt
import numpy as np

a = np.array([1,2,3,4,5])
b = a ** 2

plt.figure()
plt.plot(a, a)
plt.plot(a, b, color='red', alpha=0.7)
plt.title("Here is a graphic with only two axes")

spines=[]
for spine in plt.gca().spines.values():
    spines.append(spine)

spines[1].set_visible(False)
spines[3].set_visible(False)

plt.show()
Just set spines index 1 and 3 (or the other two indexes) to visible(False) and it all works fine.
Here is the graphic:
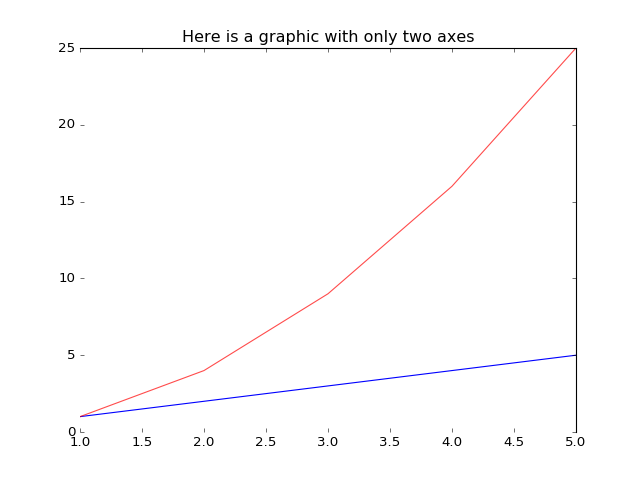
I know, you want the other two, but that way it wouldn’t be funny. Just try it!